I've never found a good tutorial for either of the systems (even less for the combination of both), but you can find several pieces here and there and end up having something decent. Certainly you can get some good tips from Baileys' youtube channel
As a quick start though:
1) Make sure you have installed and enabled signalk-to-influxdb plugin

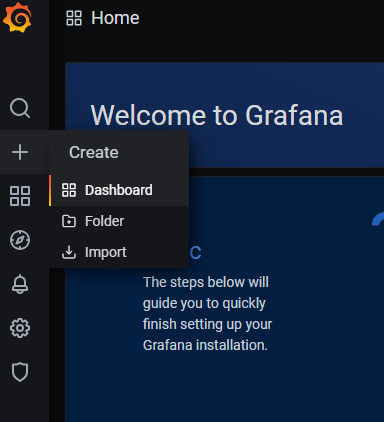
2) In Grafana home page (localhost:3001) go to create new Dashboard. In this screen you will be able to organize your new panels once you add some. Click on "+ Add new panel". You'll land on the "Edit panel" page.

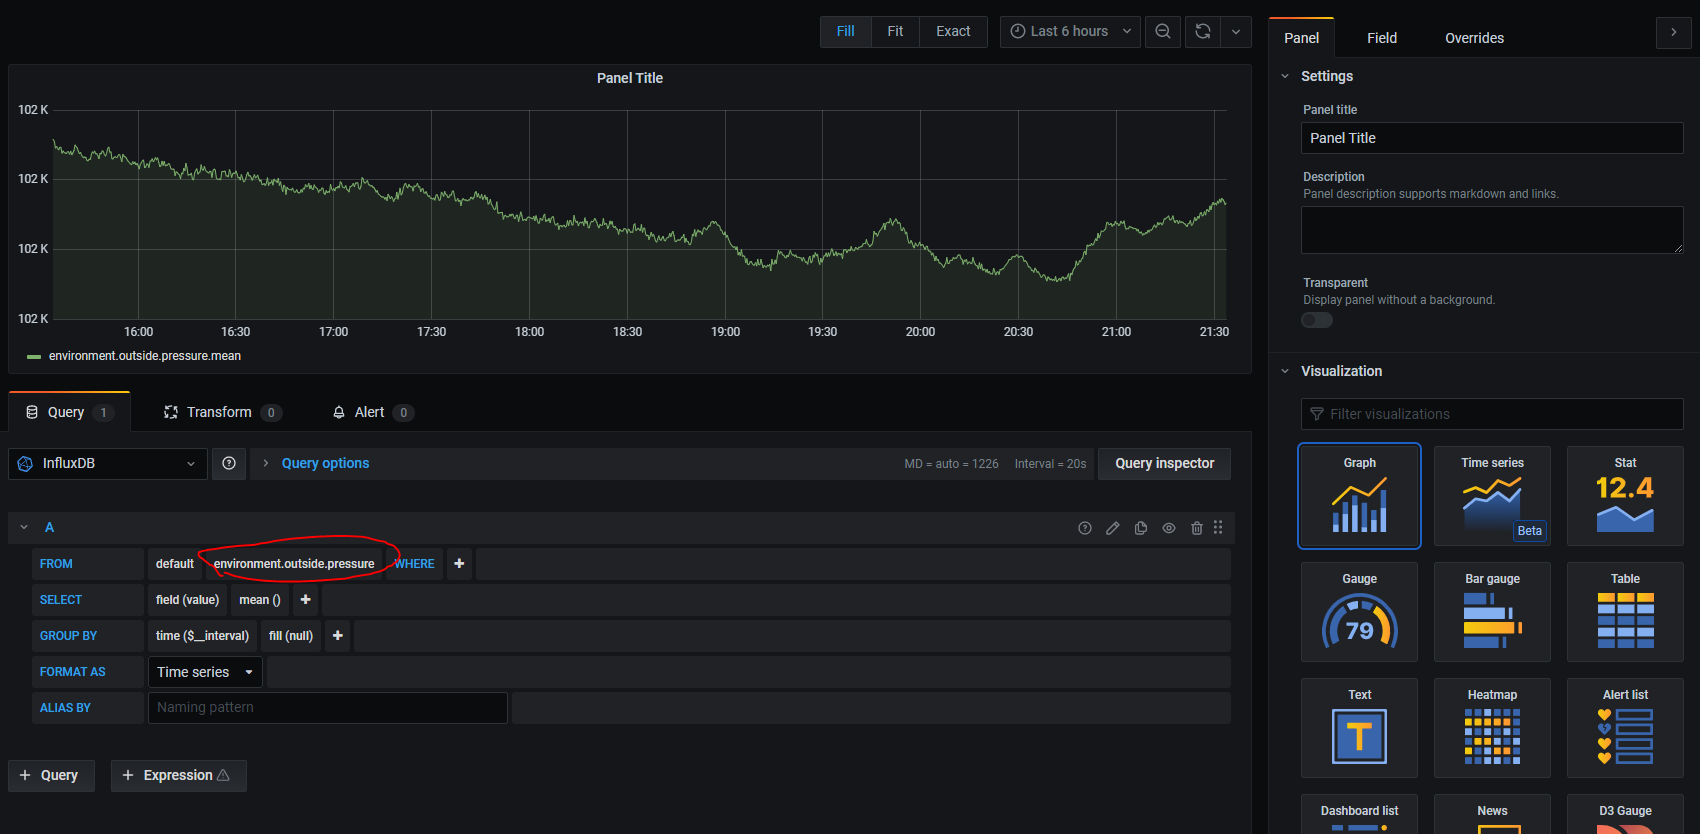
3) On the bottom side of the page you have the "Query" tab, where you can make the database query for the data you want to show. By default after installing the signal k plugin, you should already have InfluxDB as datasource. So you only need to select which data you want to display. In this picture I choose environment.outside.pressure path. Just click on "select measurement" and look for it.
4) On the right side, you have a lot of options. P.e.: in Vizualization section you can choose the type of graph. Time series is cool for barometric pressure, but you'll want a gauge for speed, for example. Or just stat for numeric values. On the top bar, you can also change the time range to display.

5) And lastly, after you save your panel and go back to the dashboard page, you can click on the arrow next to the panel title, and select "Share". That will promp a popup with the code you need to show this dashboard in another website (like KIP).
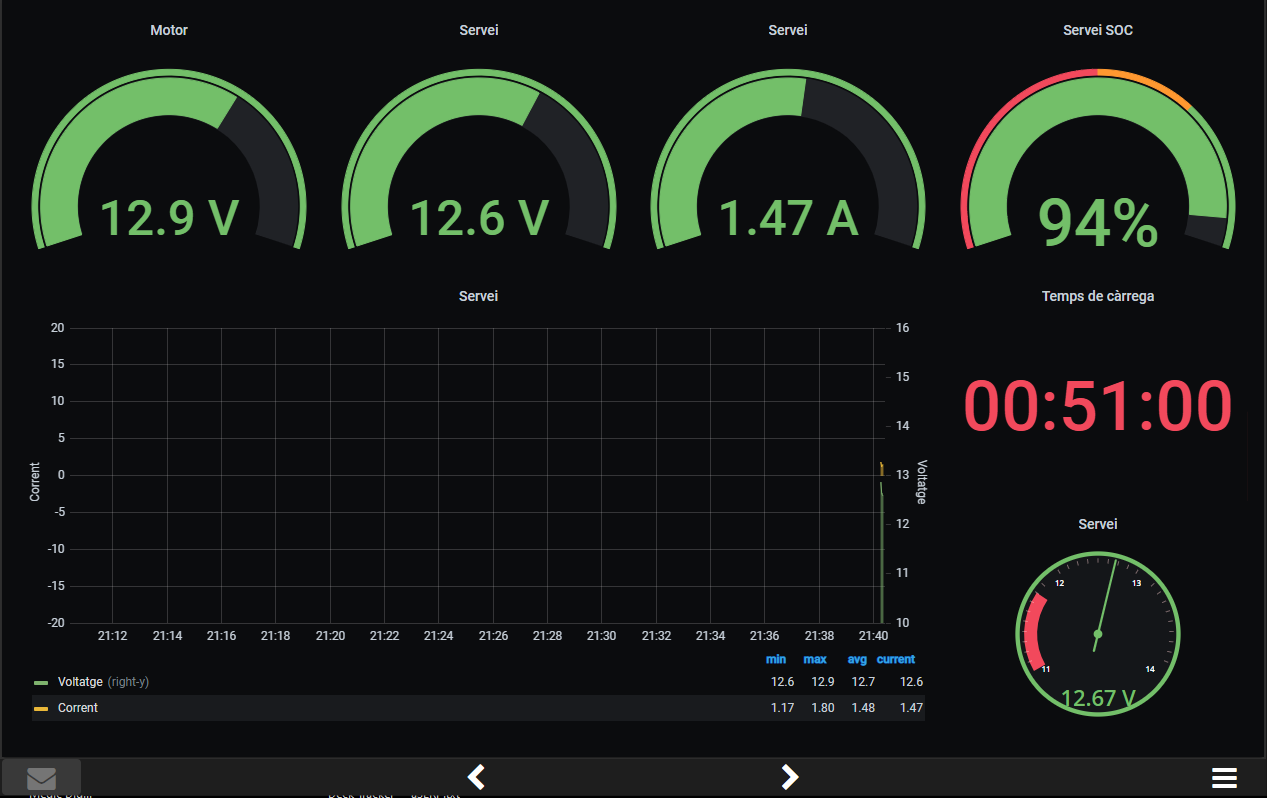
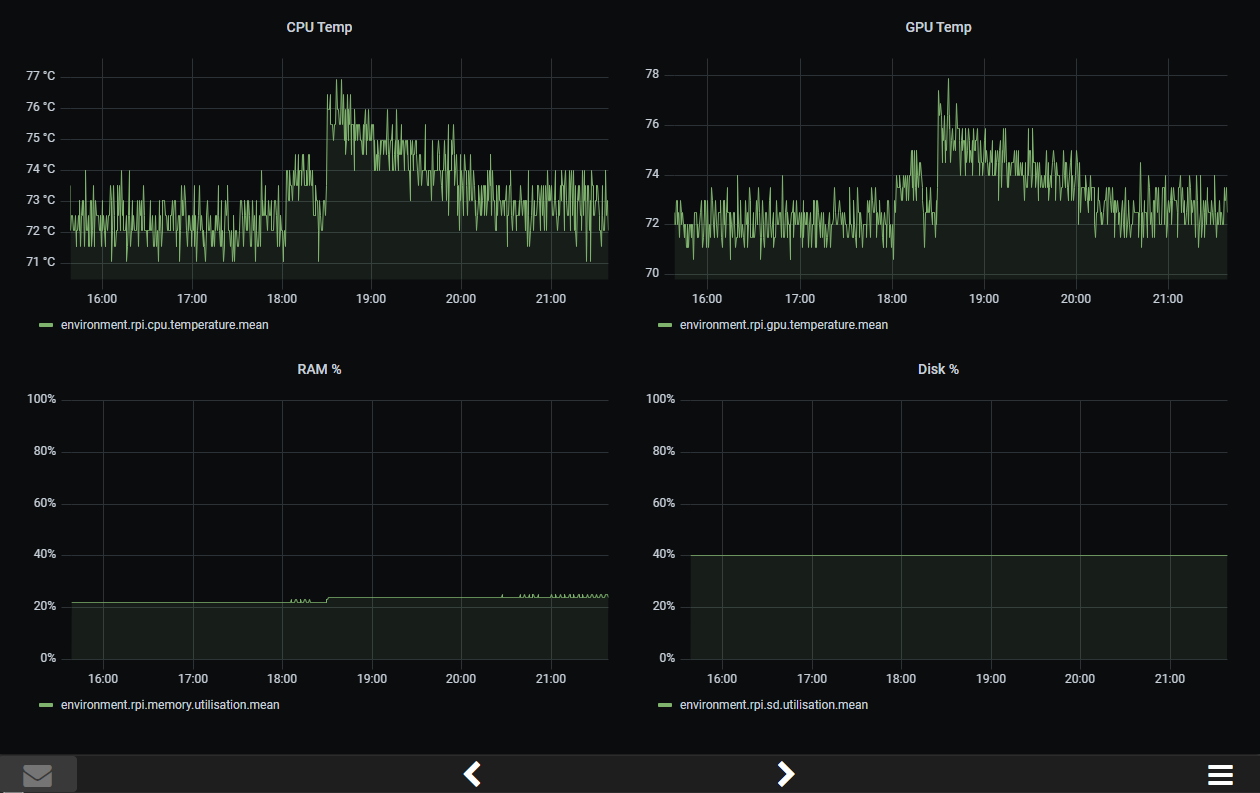
6) A couple KIP examples (battery one is copied from Boating with the bailleys actually ):
):


Obviously this is the very basics, but don't hesitate to ask more, the tool is quite powerful.
As a quick start though:
1) Make sure you have installed and enabled signalk-to-influxdb plugin
2) In Grafana home page (localhost:3001) go to create new Dashboard. In this screen you will be able to organize your new panels once you add some. Click on "+ Add new panel". You'll land on the "Edit panel" page.
3) On the bottom side of the page you have the "Query" tab, where you can make the database query for the data you want to show. By default after installing the signal k plugin, you should already have InfluxDB as datasource. So you only need to select which data you want to display. In this picture I choose environment.outside.pressure path. Just click on "select measurement" and look for it.
4) On the right side, you have a lot of options. P.e.: in Vizualization section you can choose the type of graph. Time series is cool for barometric pressure, but you'll want a gauge for speed, for example. Or just stat for numeric values. On the top bar, you can also change the time range to display.
5) And lastly, after you save your panel and go back to the dashboard page, you can click on the arrow next to the panel title, and select "Share". That will promp a popup with the code you need to show this dashboard in another website (like KIP).
6) A couple KIP examples (battery one is copied from Boating with the bailleys actually
 ):
):Obviously this is the very basics, but don't hesitate to ask more, the tool is quite powerful.


