2021-07-16, 12:16 PM
Hello every one,
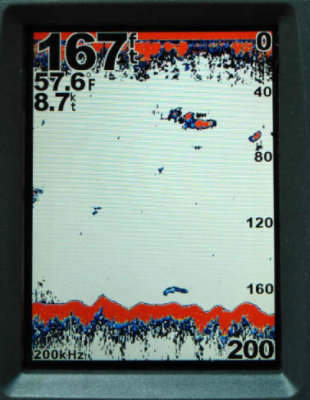
The Garmin GPSMap chart plotter that i'm slowly replacing by OpenPlotter has this display of the sounder data:

It also displays possible fishes when it finds them (although I guess there is some logic involved, not just data).
Assuming that I have NMEA0183 chart plotter's output connected to my RPi (and it's working, since I have depthBelowKeel message available in SignalK), is there any possiblity to have a similar display?
If this already exists as OpenCPN plugin or SignalK app, and you tell where to find it, that'd be great, but after some research, that doesn't seem to exist, and I don't really understand why.
If I have to code it myself, could you point me out which nmea0183 sentences should I be looking for? Or if they are already handled by SignalK? I promise to share whatever solution I end up coding
Well, if it's possible at all, because if it's not done, that could be a reason.
Thanks!
The Garmin GPSMap chart plotter that i'm slowly replacing by OpenPlotter has this display of the sounder data:
It also displays possible fishes when it finds them (although I guess there is some logic involved, not just data).
Assuming that I have NMEA0183 chart plotter's output connected to my RPi (and it's working, since I have depthBelowKeel message available in SignalK), is there any possiblity to have a similar display?
If this already exists as OpenCPN plugin or SignalK app, and you tell where to find it, that'd be great, but after some research, that doesn't seem to exist, and I don't really understand why.
If I have to code it myself, could you point me out which nmea0183 sentences should I be looking for? Or if they are already handled by SignalK? I promise to share whatever solution I end up coding

Well, if it's possible at all, because if it's not done, that could be a reason.
Thanks!


