2021-08-31, 03:38 PM
Hi,
I just install an OpenPlotter and trying to poke my setup there and here.
As a newbie in openplotter I meet with some strange things and looking for a word of wisdom from more experienced.
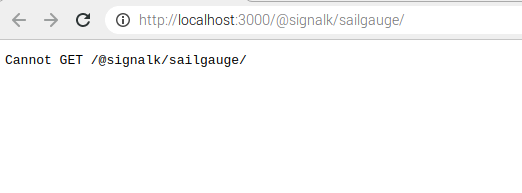
First of all, I find my "Sailgauge" page absent.

I check my logs and, yes, it's 404 error.

App Sail Gauges on Dashboards 2.2.3 marked as "installed"
It's only in my installation, or common problem?
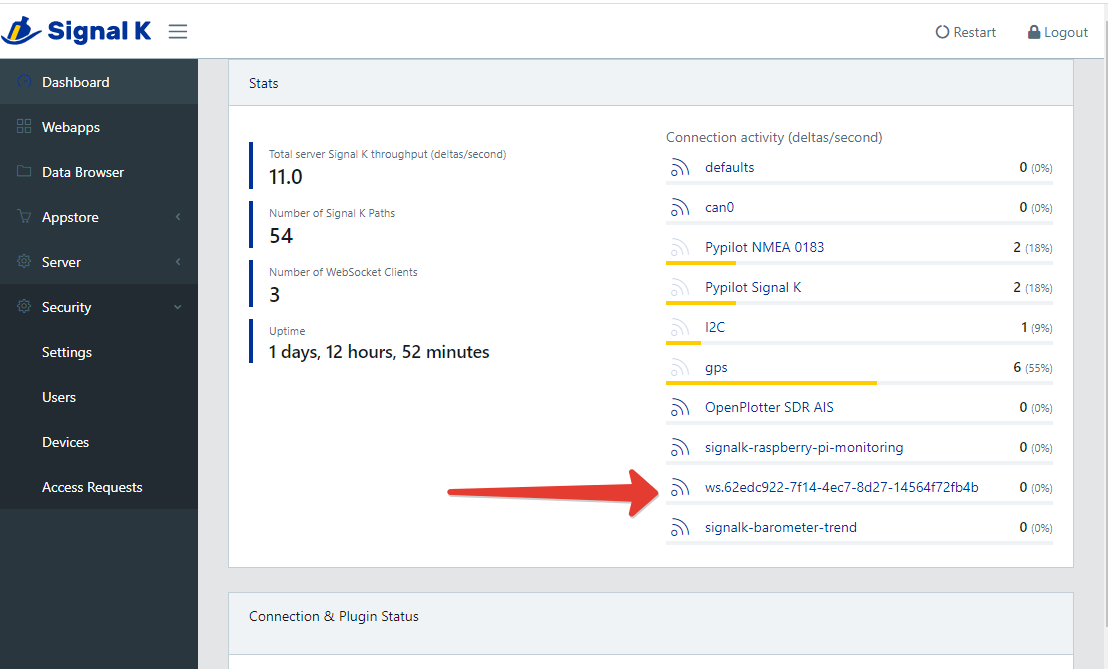
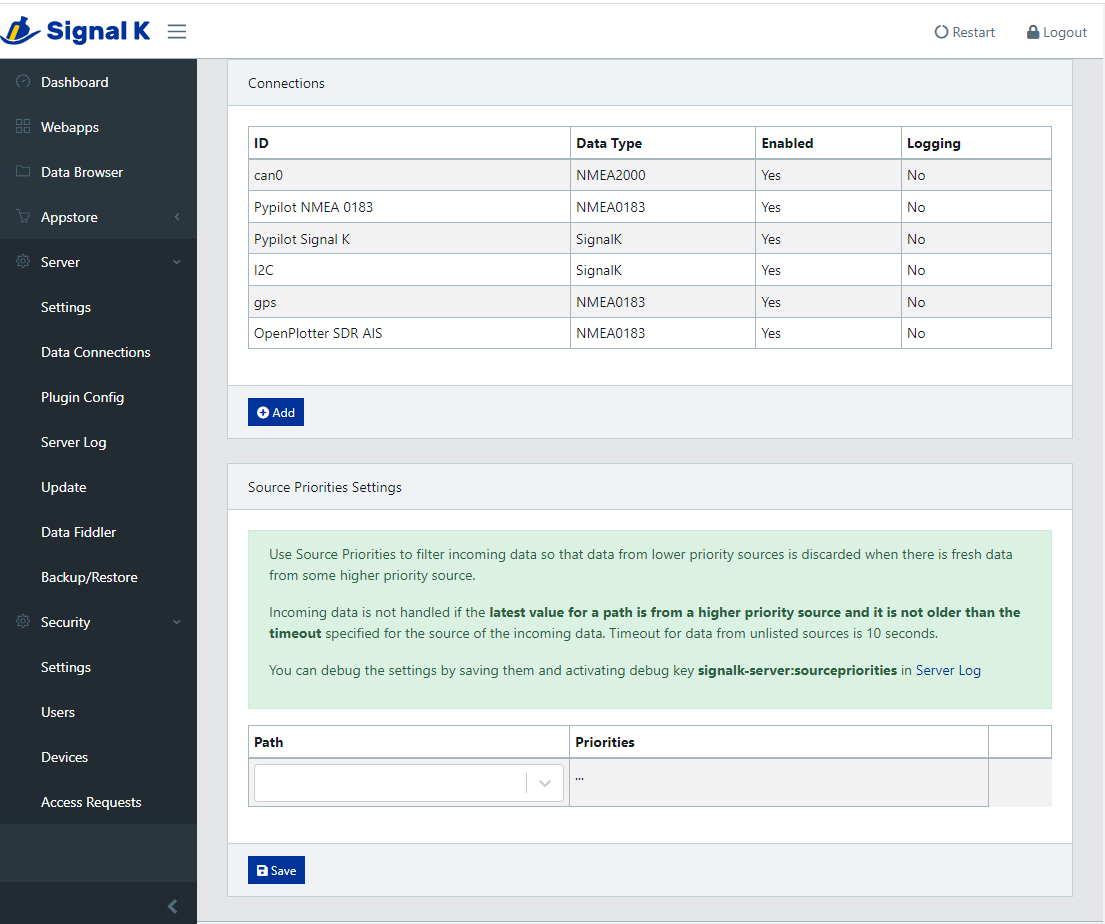
Second one strange thing I find it's a strange datasource, appeared in SignalK dashboard. It comes after some hours (!?) after first start of SK (can't remember a moment).
What is it, and how to make this name human readable?

Clickin on it gave me no useful information.

Is it needed for my setup, or it's just glitch?
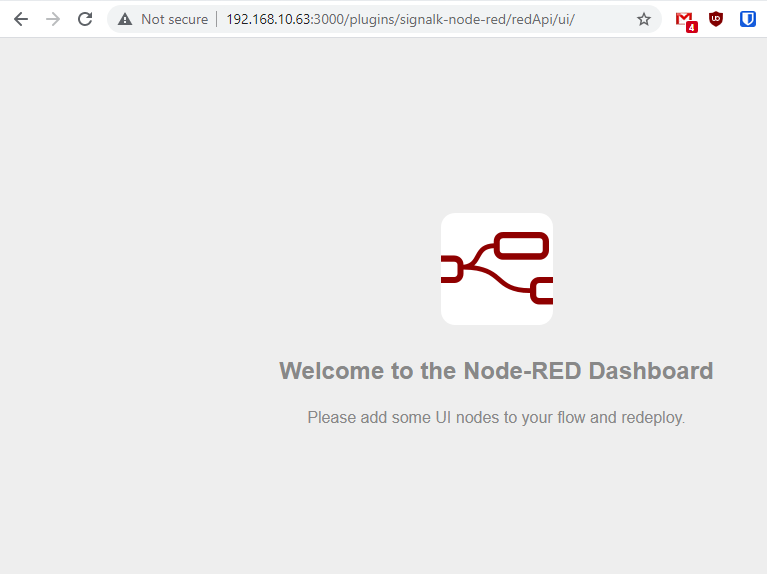
Last one issue is my Node-RED page. After installing and opening it I see no interface elements, just this one:

How can I fix it and starting to use a Node-RED?
My setup is RPi4 with PICAN-M hat and recent OpenPlotter version, SDR dongle and some sensors (BMP280, MPU9255, HTU21D), pyPilot, Lip Node-RED, Grafana, Influxdb/Chronograf/Kapacitor.
I just install an OpenPlotter and trying to poke my setup there and here.
As a newbie in openplotter I meet with some strange things and looking for a word of wisdom from more experienced.
First of all, I find my "Sailgauge" page absent.
I check my logs and, yes, it's 404 error.
App Sail Gauges on Dashboards 2.2.3 marked as "installed"
It's only in my installation, or common problem?
Second one strange thing I find it's a strange datasource, appeared in SignalK dashboard. It comes after some hours (!?) after first start of SK (can't remember a moment).
What is it, and how to make this name human readable?
Clickin on it gave me no useful information.
Is it needed for my setup, or it's just glitch?
Last one issue is my Node-RED page. After installing and opening it I see no interface elements, just this one:
How can I fix it and starting to use a Node-RED?
My setup is RPi4 with PICAN-M hat and recent OpenPlotter version, SDR dongle and some sensors (BMP280, MPU9255, HTU21D), pyPilot, Lip Node-RED, Grafana, Influxdb/Chronograf/Kapacitor.


